
Figure 1.
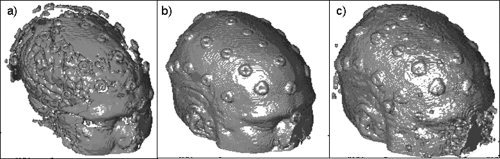
Effects of using different thresholds on surface scalp rendering obtained from MR images for one subject. (a) threshold = 0.10, TRE = 8.4 mm; (b) threshold = 0.05, TRE = 4.8 mm; (c) threshold = 0.01, TRE = 7.1 mm. Segmentation (b) shows a more appropriate surface rendition than the other two.