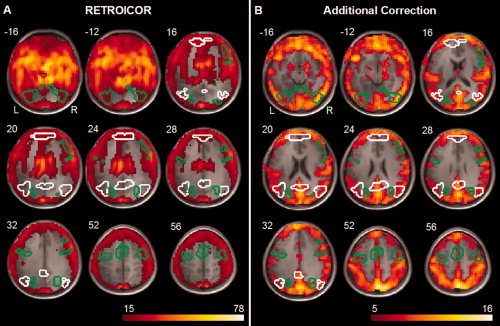
Figure 3.

Explained variance by CR effects (A) Average proportion of variance over subjects, in percentages, of resting‐state BOLD signal explained by correction for effects of cardiac pulsation and respiratory cycle (RETROICOR), (B) Average proportion of variance over subjects, in percentages, of resting‐state BOLD signal explained by additional correction for heart rate, heart rate variability, and respiration volume per time (additional correction). Explained variance is overlaid on the mean anatomical image, areas outlined in white represent DMN and outlined in green the task‐positive network. The proportion of variance of the BOLD signal during the task explained by cardiac pulsation and respiratory cycle and additional correction for heart rate, heart rate variability, and respiration volume per time yielded similar results. [Color figure can be viewed in the online issue, which is available at www.interscience.wiley.com.]
