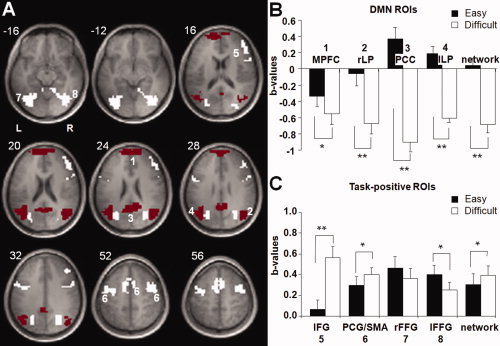
Figure 4.

Activity levels before correcting for CR effects (A) ROIs overlaid on the mean anatomical image. Red areas represent DMN and white areas ROIs of the task‐positive network. (B, C) Mean levels of (de)activation in b‐values per ROI and overall level of (de)activation in the selected areas during the easy and difficult task condition compared to baseline. Error bars represent standard error of mean. ** = P < 0.0005, * = P < 0.05. [Color figure can be viewed in the online issue, which is available at www.interscience.wiley.com.]
