
Figure 5.
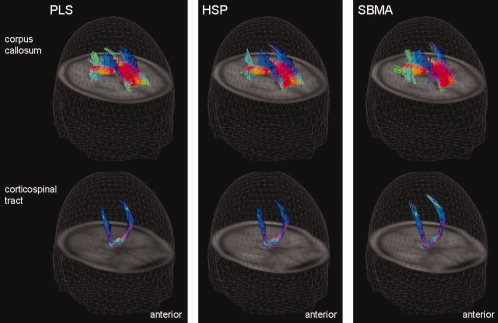
Results of the fiber tracking (FT) analysis of the PLS patient group (left column), the HSP patient group (center column), and the X‐SBMA patient group (right column). The 3D view of the comparison of tractography results with seed points within the areas of significantly reduced FA values in the CC (upper row) and in the posterior limb of the internal capsule (PLIC) of both hemispheres (lower row). According to color‐coding conventions, red means right‐left, green means anterior‐posterior and blue means cranio‐caudal directionality. FT was performed on averaged DTI datasets that were created by arithmetically averaging all MNI‐normalized single subject DTI datasets of one group (e.g., all PLS patients and the corresponding controls).