
Figure 2.
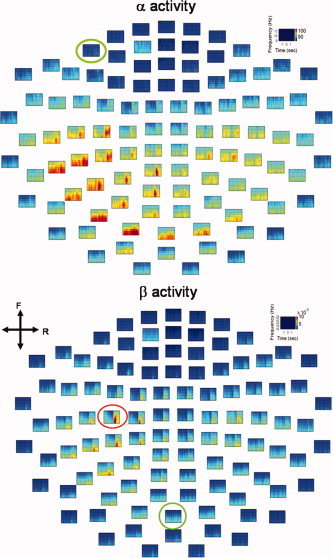
Mean time‐frequency maps of α and β oscillatory activities. The red circle indicates the channel‐of‐interest (COI) with the strongest β oscillatory activity (lower panel); the chosen COI was also used for analysis of α oscillation. Green circles denote arbitrary COIs (A‐COIs), irrelevant to the motor task. Both COI and A‐COIs were employed as reference channels in the subsequent analyses (see Figs. 4, 5). Color indicates power amplitude. The maps are shown in top view. F, front; R, right.