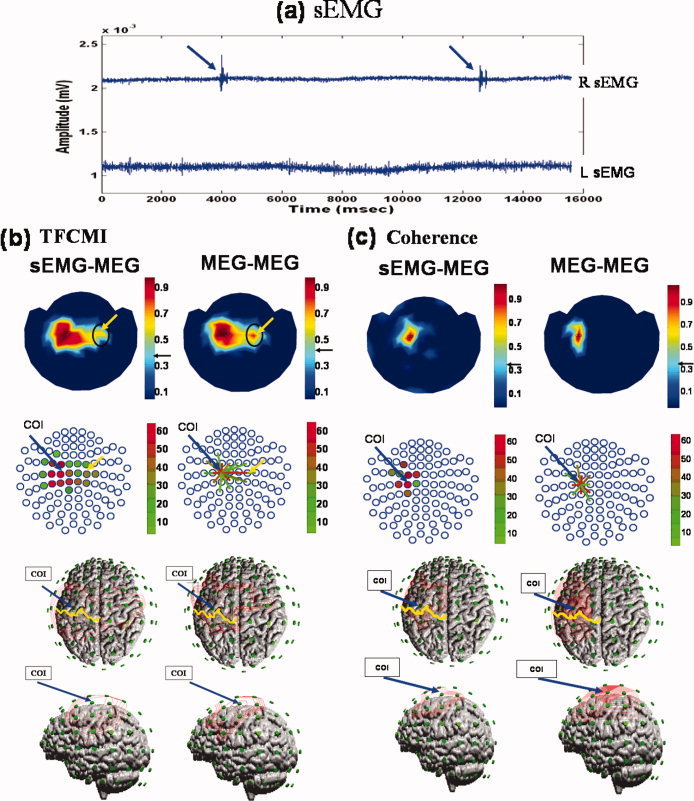
Figure 6.

Ipsilateral SM1 in between‐ and within‐modality TFCMI studies. Individual data set. (a) Right (upper trace) and left (lower trace) hand sEMGs during right finger movement (blue arrows). The left sEMG precluded mirror movement of the left hand during the experiment. (b,c) Results of β activity from TFCMI and coherence, respectively, for between‐ (sEMG‐MEG; left panel) and within‐modality (MEG‐MEG; right panel) studies. The sEMG‐MEG maps (first row) exhibit prominent corticomuscular coupling at contralateral SM1 in both TFCMI and coherence analyses, and resemble MEG‐MEG maps. Yellow arrows indicate ipsilateral SM1 encompassing by TFCMI. No such coupling was detected using the coherence method. Second row presents couplings in an alternative manner, with blue circles representing MEG sensor sites. Blue arrows anchor the COI for MEG‐MEG analysis, which is also indicated in sEMG‐MEG maps only. Coupling strengths are coded in different colors either in the form of solid dots in the sEMG‐MEG maps or line links in the MEG‐MEG maps. The third (view of the top of the head) and fourth (left lateral view of the head) rows display the isocontour maps for a better appreciation of neuroanatomical correspondence. Yellow curves are the central sulci.
