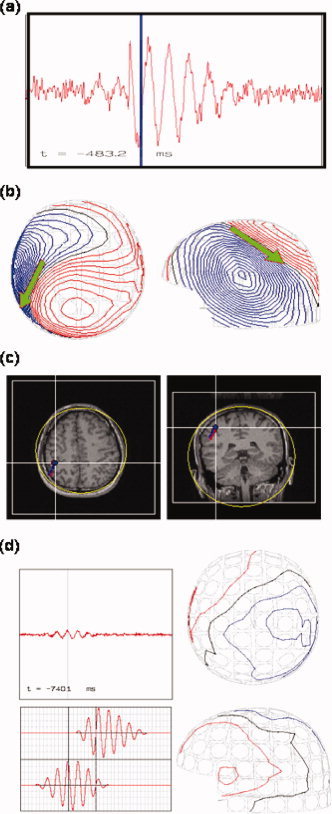
Figure 7.

Poor detection of SMA‐dipole by simulation. (a) Synthetic signals from the channel over SM1 as produced by SM1‐ and SMA‐dipoles. (b) Isocontour maps of the synthetic signals and the ECD result of SM1‐dipole. The blue bar in (a) indicates snap time for the contour maps. (c) Spatial congruence of the simulated SM1‐dipole and the estimated SM1‐dipole. The estimated SM1‐dipole (in blue, with a very high goodness‐of‐fit, about 96%) almost coincides with the simulated (in red). (d) Isocontour maps of the synthetic signals at the time point of max SMA‐dipole strength (right column). The synthetic signals from the channel over left SMA are shown in left upper panel, and the left middle and lower panels are the source activity from SM1‐dipole and SMA‐dipole, respectively. The goodness‐of‐fit for the SMA‐dipole was 42.3% (Table IV). The poor Gof for the SMA‐dipole was in line with the consensus that the MEG dipole fit for SMA source can be ambiguous due to insufficient SNR.
