
Figure 5.
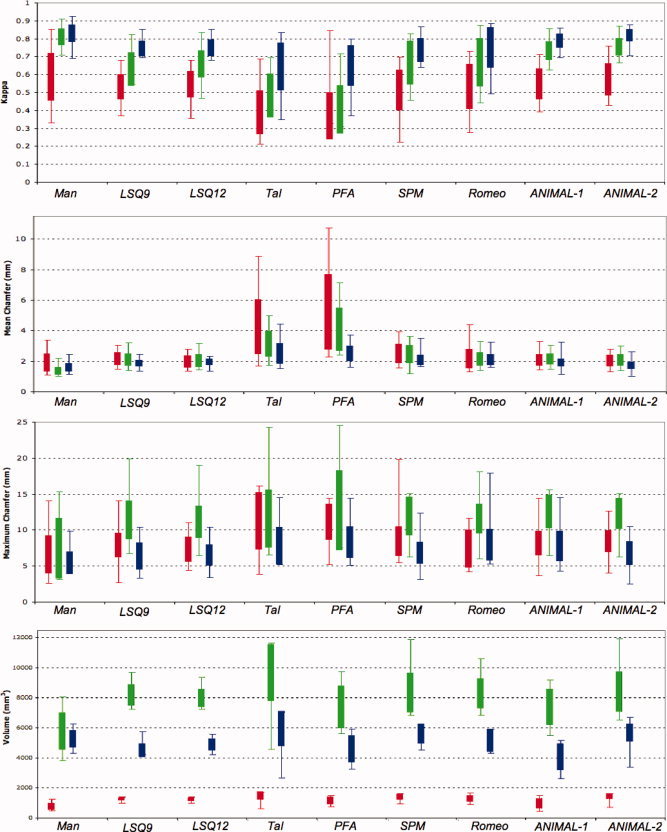
Summary of results from all metrics. From top to bottom: kappa, mean chamfer distance, maximum chamfer distance, and volume results for all methods tested for the globus pallidus (red), striatum (green), and thalamus (blue). Extents of each box represent the standard deviation and error bars represent the range of the data. [Color figure can be viewed in the online issue, which is available at www.interscience.wiley.com.]