
Figure 5.
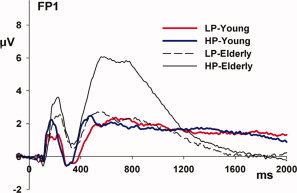
ERP patterns for young and elderly participants classified as high and low performers are illustrated over frontal scalp. These waveforms represent an ERP averaged over trial type (switch, repeat, and pre‐switch). Activity in HP‐young (blue line) and LP‐young (red line) during the early transient and late sustained period is largely overlapping, in contrast to the large differences evident between HP‐ and LP‐elderly.