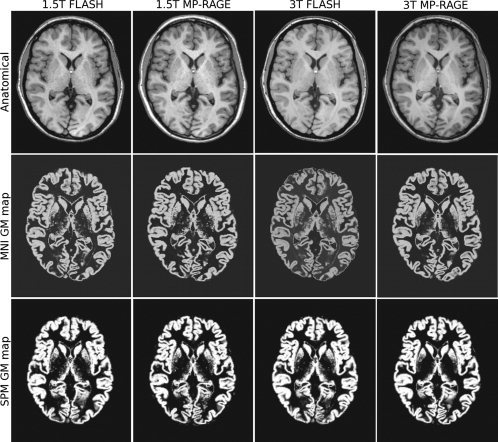
Figure 3.

Axial T1‐weighted images (top) and corresponding grey matter maps derived using the MNI tools (middle) and the SPM tools (bottom) for the four acquisition protocols. Differences in contrast and tissue classification are visible in the occipital cortex.
