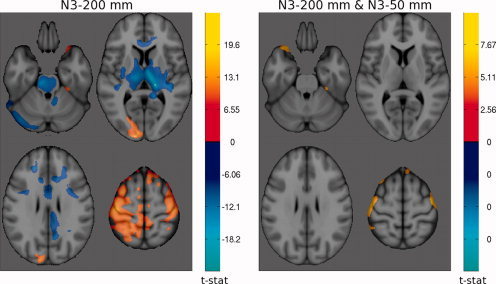
Figure 5.

t‐maps of significant differences (α = 0.05) in grey matter density between FLASH and MP‐RAGE at 1.5 Tesla. The cool colormap indicates areas of higher GM density for FLASH; and the hot colormap indicates higher GM density for MP‐RAGE. Left: N3 was applied once with a spline distance of 200 mm. Right: N3 was applied a second time after brain extraction and spatial Normalization with spline distance 50 mm.
