Figure 8.

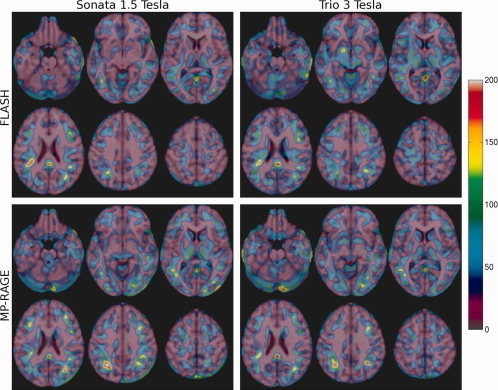
N‐maps for a cross‐sectional VBM study, where N represents the number of subjects per group required to detect a difference in GM density of 0.05 within a voxel with a level of significance of α = 0.05 and with power 1‐β = 0.90.

N‐maps for a cross‐sectional VBM study, where N represents the number of subjects per group required to detect a difference in GM density of 0.05 within a voxel with a level of significance of α = 0.05 and with power 1‐β = 0.90.