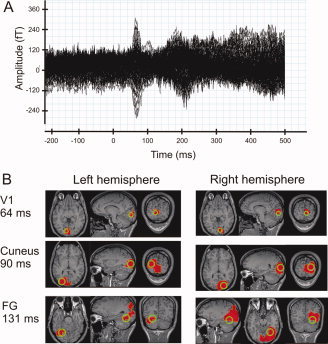
Figure 2.

Average signal and average ROI locations. (A) The average signal across 140 trials in the 151 sensors in a single run for one subject. (B) The average ROI locations (in green) and the spatial extent of the area where activity differs from baseline (in red), in at least five out of six subjects. The pattern of commonly activated areas was computed in Talairach coordinate space and back‐transformed onto an individual MRI. The actual ROI locations were individually adjusted based on the individual deflections from baseline. The displayed ROI locations are the average locations across subjects; see also Table I.
