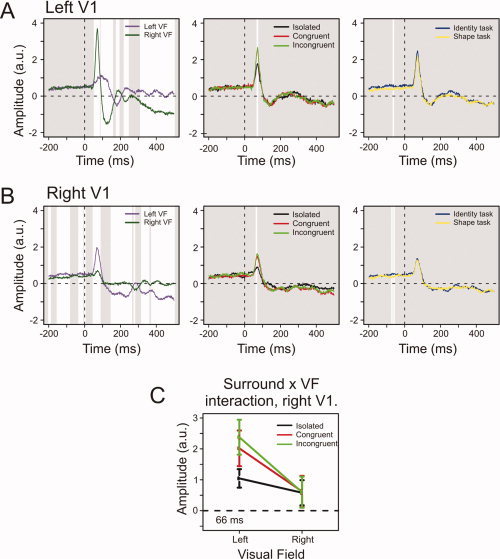
Figure 3.

V1 effects. (A) From left to right, the average RACs for the effects of VF, Surround, and Task in the left V1. White areas denote intervals of thresholded significant difference. (B) The right V1 main effects. (C) The right V1 interaction between Surround and VF at 66 ms after stimulus onset. The first evoked peak in the right V1 was selective for Surround only for contralateral stimuli. Error bars denote 95% confidence intervals around the mean; the depicted time‐point is that of the minimal P‐value for the interaction. [Color figure can be viewed in the online issue, which is available at www.interscience.wiley.com.]
