
Figure 4.
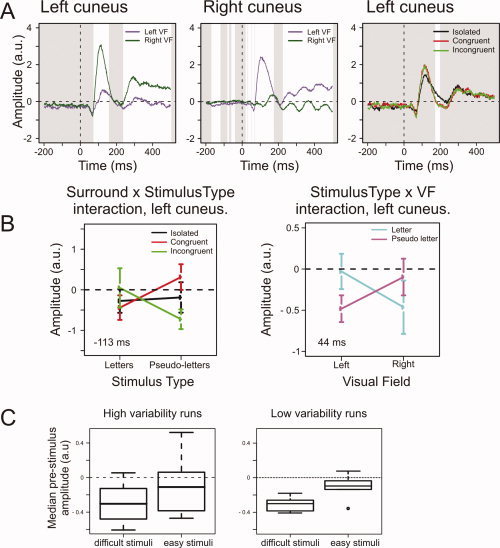
Cuneus effects. (A) The average RACs for the VF effects in left and right Cuneus and of Surround in the left Cuneus. White areas indicate intervals of significant difference. (B) The two left Cuneus interaction effects. The Surround and Stimulus Type interaction shows an anticipatory decrease in amplitude for letters with congruent surrounds and pseudoletters with incongruent surrounds; these stimuli are perceptually difficult [van Leeuwen and Lachmann,2004]. The right graph shows the evoked VF and Stimulus Type interaction at 44 ms poststimulus. Bars denote 95% confidence intervals around the mean; the depicted time‐points are those with minimal P‐values for the respective interactions. (C) Boxplots of the median prestimulus amplitudes in the left Cuneus for “difficult” and “easy” stimuli, separated for runs where the conditional probability for these stimuli varied more (left plot) or less (right plot). The anticipatory effects are most reliably observed for runs with low variability in the conditional probability for difficult stimuli. [Color figure can be viewed in the online issue, which is available at www.interscience.wiley.com.]