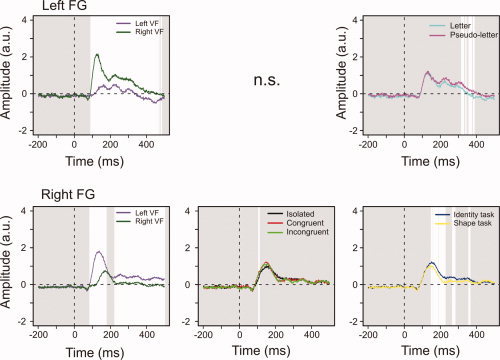
Figure 5.

Fusiform gyrus effects. White areas indicate intervals of significant difference. The VF effects were similar in each FG. The right, but not left, FG showed a significant Surround effect. Left FG had lower amplitudes for letters than pseudoletters between 300 and 400 ms poststimulus. The right FG showed task‐specificity starting 150 ms after stimulus onset. [Color figure can be viewed in the online issue, which is available at www.interscience.wiley.com.]
