
Figure 3.
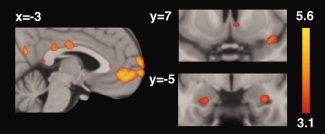
Whole‐brain analysis of the contrast comparing positive‐feedback to control‐feedback conditions. Regions demonstrating greater activation to positive‐feedback faces compared to control‐feedback faces included vmPFC, mid‐cingulate, PCC, precuneus, ventral midbrain, right NAcc, right insula/operculum, and left and right amygdalae. For this figure, and the figures that follow, activations are displayed on a high‐resolution (0.5 mm isotropic) version of the MNI152 standard brain. Corresponding color bars indicate the Z‐score ranges of the displayed activation maps. Images are displayed in neurological convention (left = left).