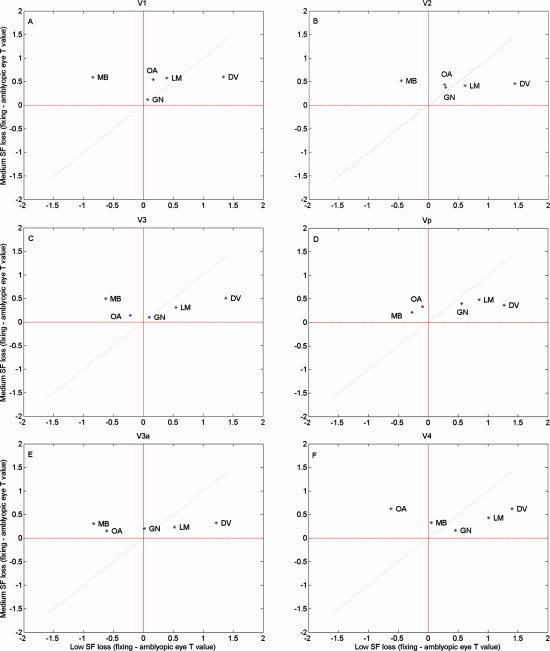
Figure 2.

Comparison of the deficits at 4 and 0.5 c/d. Comparison of the deficit (t value fixing eye‐T statistic amblyopic eye) for the medium spatial frequency stimulus relative to that for the low spatial frequency stimulus for the random block design for the subjects that showed a significant deficit in Experiment 1. The dashed line has a slope of unity and indicates comparable high/low spatial frequency deficits. [Color figure can be viewed in the online issue, which is available at www.interscience.wiley.com.]
