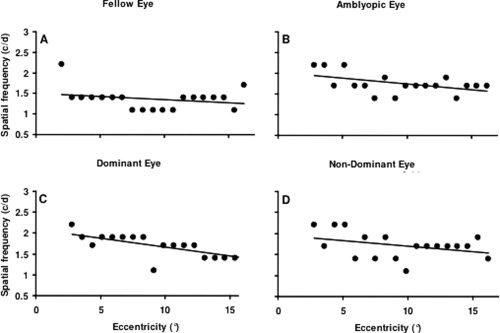
Figure 4.

Spatial frequency preferences across eccentricity. Peak spatial frequency preference within the 0.5 to 3 c/d range as a function of eccentricity within V1. Data are pooled across upper and lower visual hemifields, hemispheres and subjects and is shown for the fellow fixing (A) and amblyopic eye (B) of amblyopes and the dominant (C) and nondominant (D) eye of controls. Only voxels that showed a significant preference for both a spatial frequency and an eccentricity (P < 0.05) were included in the plots.
