
Figure 3.
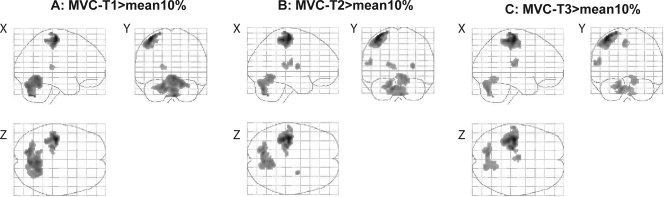
Activated brain areas during the sustained high‐force contraction compared to the mean activity during the sustained low‐force contraction. To follow the changes over time we divided the 2‐min contraction into three equal parts (MVC‐T1, MVC‐T2, and MVC‐T3). Panel (A) shows areas activated during the first part of the sustained MVC (MVC‐T1 > mean10%), (B) during the second part (MVC‐T2 > mean10%) and (C) during the last part of the contraction (MVC‐T3 > mean10%; all pictures corrected for multiple comparisons T ≥ 5.28, k = 20 voxels).