
Figure 5.
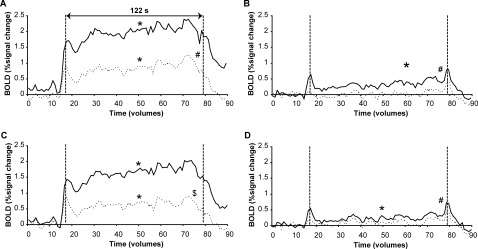
Mean BOLD signal per volume during the sustained high‐force contraction (fatiguing; A, C) and sustained low‐force contraction at 10% MVC (non‐fatiguing; B, D) in the contralateral (uninterrupted line) and ipsilateral (dashed line) precentral (A, B) and postcentral (C, D) gyrus. Statistical analysis was performed on the datapoints between the vertical dashed lines (61 volumes, 122 s). * denotes main effect of time, # denotes significant difference between hemispheres and $ denotes interaction effect between hemisphere and time (All: P < 0.05).