
Figure 7.
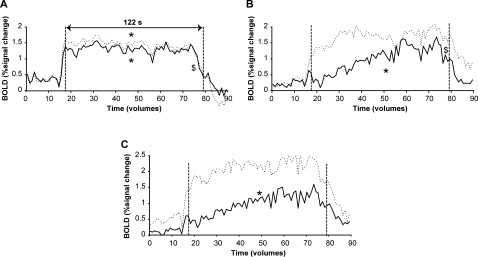
BOLD signal per volume during the sustained high‐force contraction in the contralateral (uninterrupted line) and ipsilateral (dashed line) cerebellum (lobule IV,V and VI; A), precentral gyrus pars opercularis (B) and the insular cortex (C). Statistical analysis was performed on the datapoints between the vertical dashed lines (61 volumes, 122 s). * denotes main effect of time, $ denotes interaction effect between hemisphere and time (All: P < 0.05).