
Figure 2.
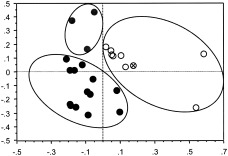
Classification of individuals with right mTL seizures (empty dots), individuals with left mTL seizures (gray dots), and healthy subjects (black dots) into circumscribed, nonintersecting clusters by the expression coefficients of PC1 and PC3. One individual with simultaneous onset of seizure discharge in right and left foramen ovale electrodes is located in the right mTL seizure cluster (highlighted by the sign ×).