
Figure 4.
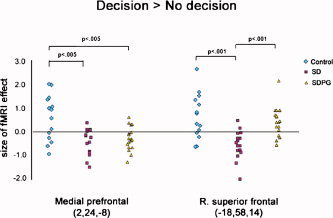
Size of fMRI effect during decision‐making for ventral medial frontal and right orbitofrontal regions (MNI coordinates shown) was largest in controls, followed by SDPG, followed by SD. Data represent size of fMRI effect (β) for individuals. Data were analyzed using ANOVA and post‐hoc Tukey's, controlling for education and IQ.