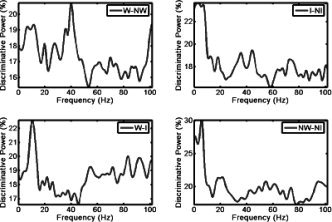
Figure 2.

Discriminative power (DP) as a function of frequency: plot of mean over subjects' DP as a function of frequency for all possible contrasts between pairs of visual stimuli. The DP is a measure between 0 and 100 indicating the amount of trials that can be correctly decoded using a single frequency and voxel in the brain. It therefore provides a minimal bound (classification results increase after combining multiple features) to decoding results.
