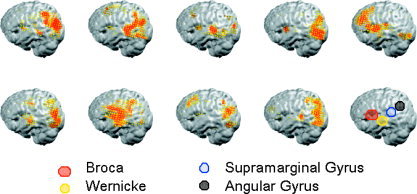
Figure 3.

Individual images showing the anatomical location of the best 150 voxels used for classification in the W‐I condition. To construct the image, we assigned a value of one to voxels and frequencies belonging to the best 150 features used for classification and averaged over the whole range of 0–100 Hz. The last right‐most panel shows a schematic drawing of the major brain regions linked to language and reading. Note that despite some interindividual variability, the best 150 voxels cluster together around regions that coincide well with classical language areas.
