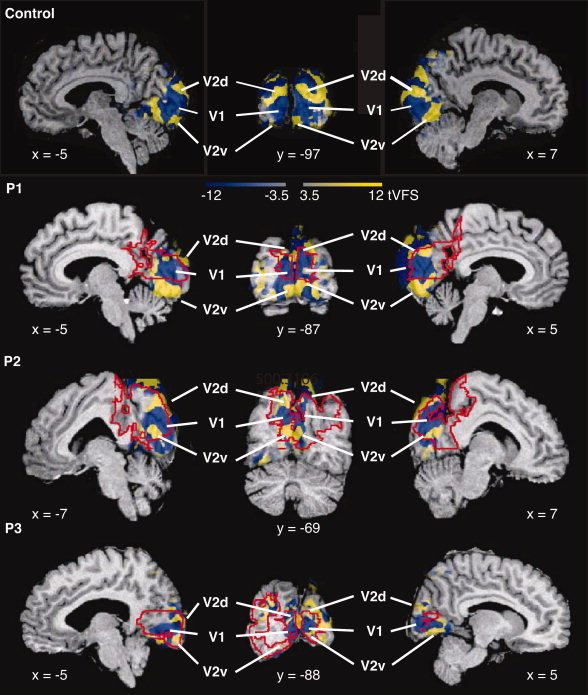
Figure 3.

VFS maps are shown overlaid on the corresponding anatomical images for a control subject and the three patients in a stereotaxic space, weighted by the corresponding t‐statistical maps (tVFS). For each patient two sagittal slices through each hemisphere and a coronal slice are shown. Stereotaxic coordinates are indicated next to the slices. Blue and yellow correspond to opposite field signs, mirror and nonmirror image, respectively. The color intensity (both blue and yellow) reflect the t‐statistical value (|t| = 4.7 corresponds to P = 0.05, corrected for multiple comparisons). Different visual areas can be identified and are labeled in the volumes. Polymicrogyric cortex is delineated by red lines. [Color figure can be viewed in the online issue, which is available at www.interscience.wiley.com.]
