
Figure 4.
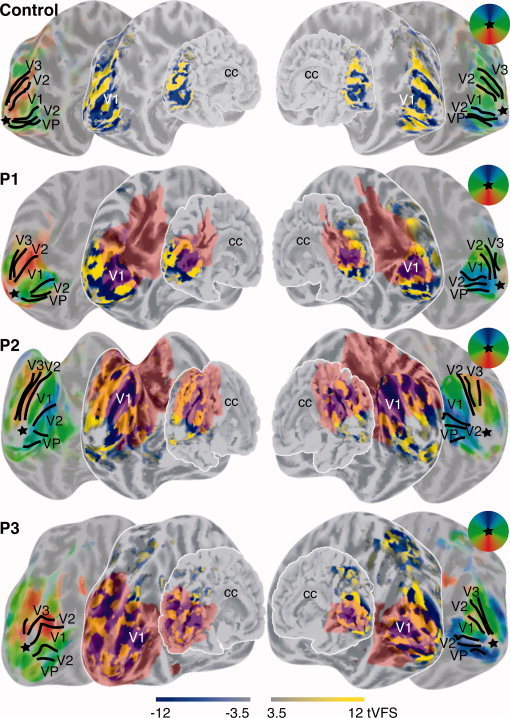
tVFS images are shown for a control subject and the three patients overlaid on their corresponding folded and unfolded cortical surfaces. All surfaces are viewed from a medio‐posterior viewpoint. Sulci are colored darker gray then the gyri. The corpus callosum (cc) is labeled to facilitate orientation on the surfaces. Besides surfaces overlaid with the tVFS maps, the same surfaces are shown overlaid with colored polar‐angle phase maps in identical views. Thus, all left and right surfaces are shown in identical views but contain different information. The visual fields reflected by the colors of the polar‐angle map are indicated in the circular window. The intensity of the phase maps is weighted by the t‐statistical maps identical to the tVFS maps. The black lines indicate borders between visual areas derived from the tVFS maps. The star indicates the approximate cortical representation of the fovea. [Color figure can be viewed in the online issue, which is available at www.interscience.wiley.com.]