
Figure 6.
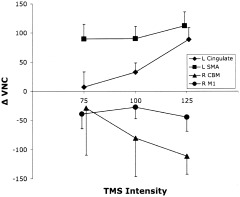
Remote responses: VOI data. PET VOI data are plotted for the four regions in which blood‐flow changes correlated most strongly (either positively or negatively) with blood‐flow responses in M1hand: left cingulate gyrus; left SMA; right cerebellum; right M1hand. PET responses were quantified as the change in value normalized counts (ΔVNC) from the unstimulated baseline state. All plotted values are means (n = 7). Error bars are ± 1 SEM.