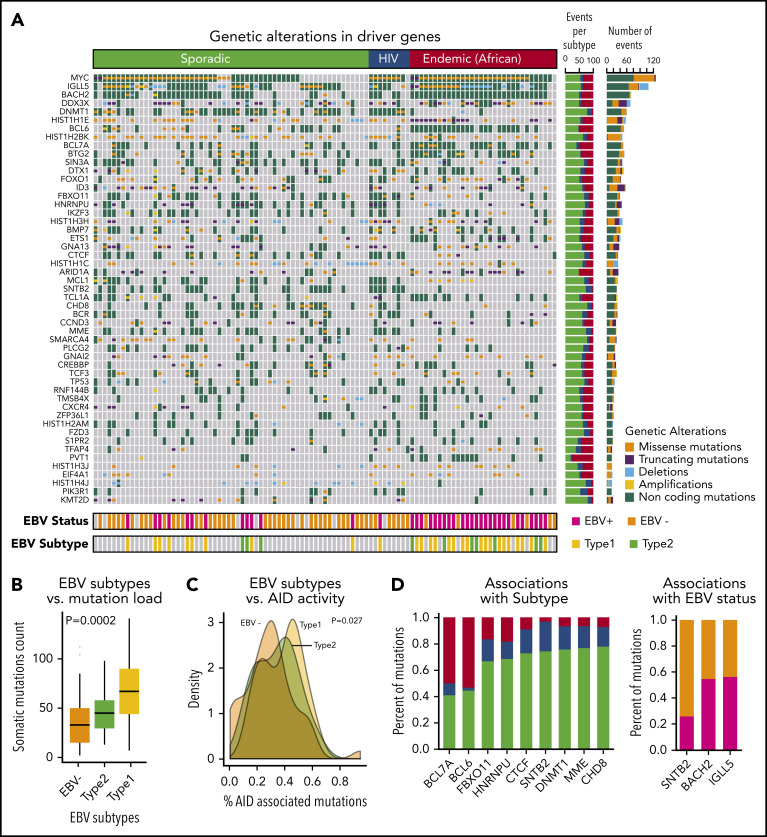
Figure 2.
Landscape of genetic drivers in BL subtypes. (A) Heatmap of genetic alterations across BLs for the driver genes mutated in at least 15 samples. The bar plot on the right shows the sample counts for each of the driver genes. (B) Box plots showing the differential mutation load across the EBV subtypes. (C) Distribution of the proportion of AID-associated mutations for EBV status. (D) Bar plots showing genetic alterations significantly associated with BL subtypes (left) and EBV status (right).

