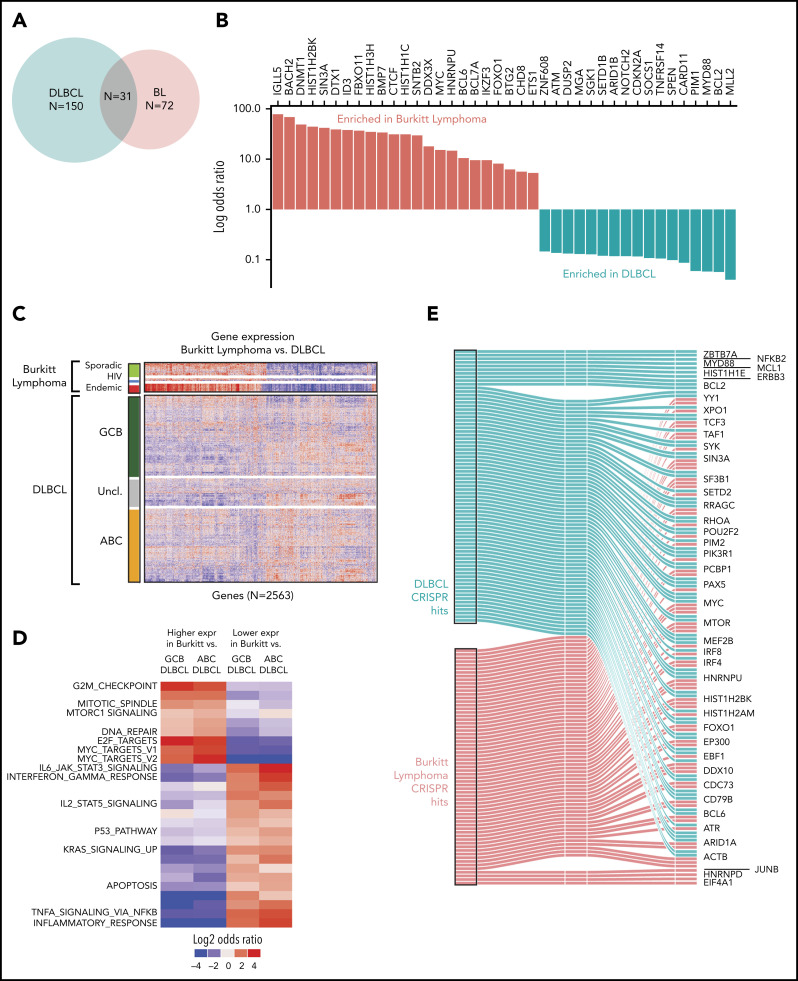
Figure 4.
Comparison of BL to DLBCL. (A) Comparison of mutational driver in BL vs DLBCL are shown in a Venn diagram. (B) Bar plot showing contrasting mutational frequencies. (C) Heatmap of differential genes is shown for BL and DLBCL subgroups. (D) Heatmap of differential gene sets for BL vs ABC and GCB DLBCL. (E) Essential genes in BL and DLBCL identified by CRISPR knockout screen. Essential genes are grouped as BL-specific, DLBCL-specific, or shared (effects in both) effects upon knockout.

