Figure 4.
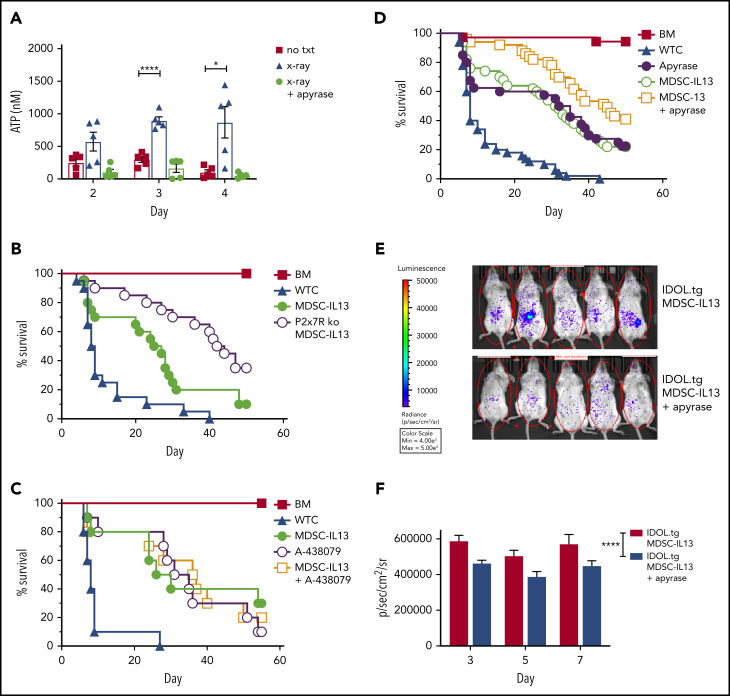
Extracellular ATP associated with MDSC loss of function. Balb/c mice were lethally irradiated then euthanized on the day indicated, injected intraperitoneally with 1 mL of cold RPMI. Animals marked X-ray plus apyrase received a single intraperitoneal injection of 10 units of apyrase 2.5 hours before euthanization. (A) Fluid was recovered from the peritoneal space to prechilled tubes and assayed for extracellular ATP. Data are representative of 2 independent experiments, n = 5 per group. (B) Kaplan-Meier survival curve of Balb/c-recipient GVHD animals receiving MDSC-IL13s (M13) or P2x7R KO MDSC-IL13s. Whole T cells (WTCs) vs M13, P = .0052; WTCs vs P2x7R KO, P < .0001; M13 vs P2x7R KO, P = .0158. Data are representative of 2 independent pooled experiments, n = 20 per group. (C) Kaplan-Meier survival of Balb/c GVHD mice treated with A-438079 (80 mg/kg intraperitoneally daily from day 0 to +4) with or without MDSC-IL13s as indicated. WTCs vs M13, P = .0028; WTCs vs A438079, P = .0002; WTCs vs A438079 plus M13, P = .0012; M13 vs A438079 or A438079 plus M13, P = not significant. Data shown represent a single experiment, n = 10 per group. (D) Kaplan-Meier survival curve of GVHD mice treated with apyrase (4 U intraperitoneally daily from day 0 to 4) or MDSC-IL13 plus apyrase, as indicated. WTCs vs M13, apyrase, or M13 plus apyrase, P < .0001; M13 vs apyrase, P = not significant; M13 vs apyrase plus M13, P = .0063; apyrase vs M13 plus apyrase, P = .0164. Data represent 5 combined independent experiments, n = 50 per group. (E) Animals were treated as in panel D using IDOL-transgenic donors and then on day 3 posttransfer assayed for whole-body bioluminescent imaging 5 minutes after D-luciferin injection. (F) Summary data are from a single experiment, n = 12 to 14 mice per group, and are representative of 2 independent experiments. *P < .05, ****P < .0001. txt, treatment.

