Figure 6.
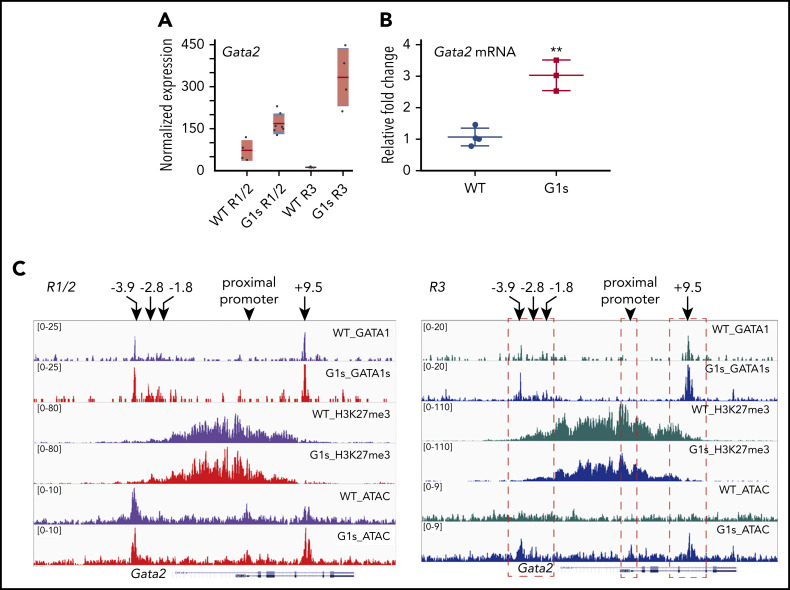
GATA2 is overexpressed in Gata1s erythroid cells. RNA-seq (A) and RT-qPCR (B) confirming the increased expression of GATA2 in G1s erythroid cells. Total mRNA was extracted from E13.5 fetal liver cells for RT-qPCR. (C) Tracks depicting CUT&RUN-seq of GATA1, GATA1s, and H3K27me3 as well as ATAC-seq at the genomic locus of Gata2 in the R1/2 and R3 populations. Histograms were normalized to account for differences in the number of reads per library. Four well-studied regulatory elements (−3.9 kb, −2.8 kb, −1.8 kb, and +9.5 kb) and the proximal promoter of Gata2 are indicated by arrows. Red dashed boxes (right) highlight the changes in H3K27me3 and differential chromatin accessibility (ATAC-seq) at GATA1/GATA1s-binding sites and the Gata2 proximal promoter. **P ≤ .01 (unpaired Student t test).

