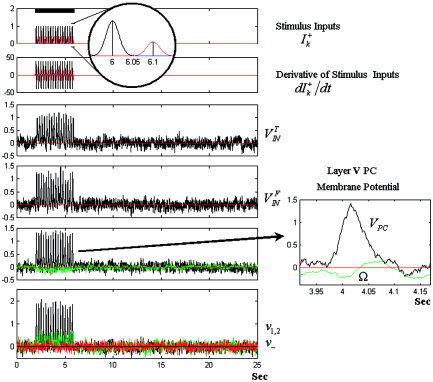
Figure 4.

The integration of the SDE. The synaptic inputs and their derivatives are shown in the upper panel. A single realization of the electrical states V , V PC, Ω, ν1,2, ν− are shown in the panels below. The plot for the membrane potential at V PC the soma of the layer V PC and the implicit electrical state Ω corresponding to a single event is highlighted on the right. For visualization, Ω was rescaled by a factor of 0.15. The black bar represents the stimulation window. The membrane potentials and intrinsic electrical states are given in mV.
