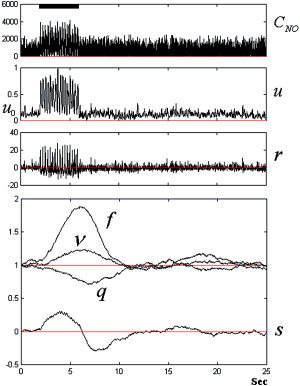
Figure 7.

The integration of the SDE. A single realization showing the temporal dynamics of the concentration of NO C NO (in nM) in the cortical unit (upper panel). The panels below show a realization of the input to the extended balloon approach u and its derivative r = du/dt. Also, single realizations of the flow‐inducing signal s, the CBF f, the CBV v, and the concentration of dHb q are shown in the last panel. The black bar represents the stimulation window.
