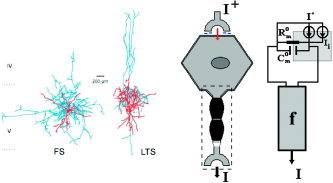
Figure A2.

The GABAergic interneuron. A symbolic representation of the inputs and output (middle). The equivalent electrical circuit (right). On the left, biocytin‐filled and reconstructed FS (fast‐spiking) and LTS (low threshold‐spiking) GABAergic INs in the neocortical layer V of rodents [adapted from Bacci et al.,2003, © 2003 by the Society for Neuroscience]. The axons are in blue and the dendrites are in red.
