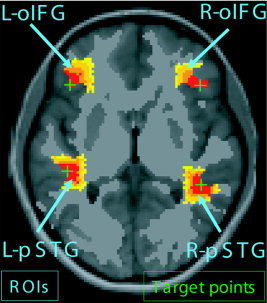
Figure 1.

Schema of the fMRI‐located ROIs. The green crosses represent the target points, which are identified by the local maximum of the related fMRI activation. The red‐to‐yellow regions define the ROIs that have been generated by a geodesic region‐growing algorithm; all 4 ROIs have the same volume.
