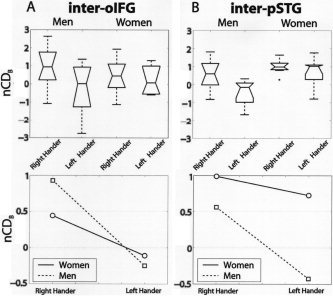
Figure 5.

Interhemispheric connectivity (nCDB), box plots, and interaction plots (see Interhemispheric Connectivity). A: Inter‐oIFG connection density does not show any difference between men and women, RH and LH. B: Inter‐pSTG connection density exhibits a significant handedness and sex effect. The connections of the LH men are particularly sparse.
