
Figure 2.
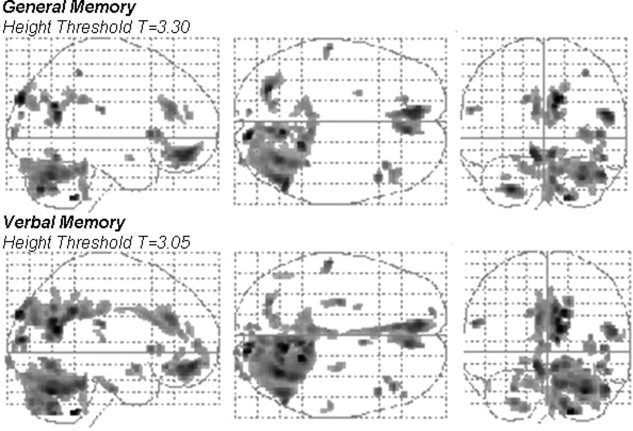
The parametric map of the t statistic depicts the location and the statistical significance of voxels with a significant correlation between density of gray matter and general memory (top row) and verbal memory (bottom row) in patients with left MTLE. The map is overlaid in a glass brain template. Images are shown in radiological convention, i.e., left side of images corresponds to the right brain hemisphere.