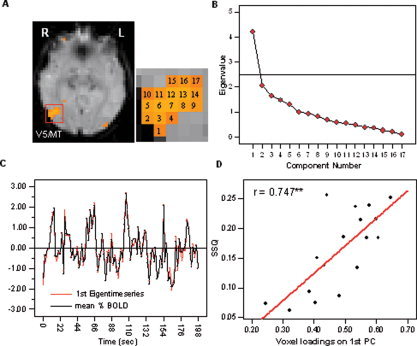
Figure 1.

A: Results of the PCA carried out across voxels within a significantly activated cluster in V5 for a representative subject. B: The SCREE plot indicated that only one component fell above the last large drop on the display and exhibited an eigenvalue larger than 1.0. C: The first eigentime series is very similar to the average observed time series within the cluster. D: There was a significant positive correlation between the voxel factor loadings on the first component and the level of significance (SSQ index) indicated by the functional activation map. [Color figure can be viewed in the online issue, which is available at www.interscience.wiley.com.]
