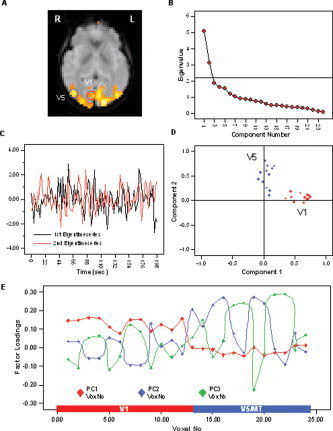
Figure 4.

A: Results of the PCA carried out across voxels in V1 in combination with voxels in V5 for a representative subject. B: The SCREE plot indicated two significant components falling above the last large drop of eigenvalues and exhibiting an eigenvalue larger than 1.0. C: Display of the first and second eigentime series. D: Factor loading display following orgothonal component rotation using the VARIMAX criterion. Voxels in V1 exhibit high loadings on the first PC but low correlation with the second PC, whereas voxels in V5/MT exhibit high loadings on the second and low loadings on the first PC (i.e., simple structure). First eigentime series therefore represents an average pattern of functional activation in V1, and the second eigentime series represents activation in V5. E: Factor loadings display on the extracted first four components, while only the first two components met the outlined criteria. Voxels in area V1 are indicated by the blue bar, voxels in V5/MT are indicated by the red bar. [Color figure can be viewed in the online issue, which is available at www.interscience.wiley.com.]
