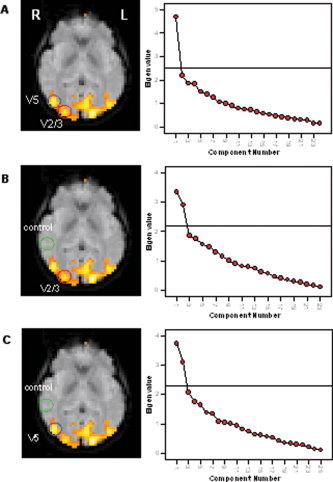
Figure 5.

Results of the PCA carried out across V2/3 in combination with V5 and the control regions for a representative subject. A: SCREE plot following the analysis of voxels in V2/3 in combination with V5/MT revealed only one significant component. B and C: Two significant components were observed when V2/3 or V5/MT was analyzed in combination with the control region. [Color figure can be viewed in the online issue, which is available at www.interscience.wiley.com.]
