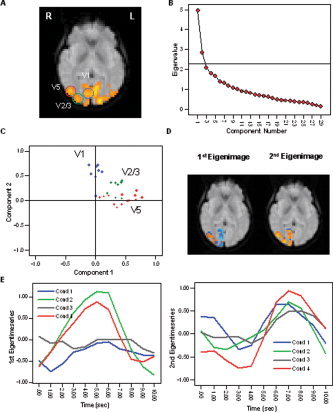
Figure 6.

A: Results of the PCA carried out across voxels in V2/3, V1, and V5/MT for a representative subject. B: The SCREE plot indicated two significant components falling above the last large drop of eigenvalues and exhibiting an eigenvalue larger than 1.0. C: The factor loadings display after VARIMAX rotation indicates that voxels in V5/MT exhibit generally high loadings on the first PC, and voxels in V1 exhibit high loadings on the second PC. Voxels in V2/3 show medium loadings on both components. D: A regional classification of the components can also be observed in the eigenimages. Positive factor loadings are displayed in orange; negative loadings are displayed in blue. E: Average BOLD responses for each stimulation condition extracted from the first (left) and second (right) eigentime series. The responses based on the first eigentime series, which represents the average pattern of response in V5/MT, clearly highlight the response selectivity for moving stimuli (conditions 2 and 4). The second eigentime series representing functional activation in V1 indicates a characteristic response in all stimulation conditions. [Color figure can be viewed in the online issue, which is available at www.interscience.wiley.com.]
