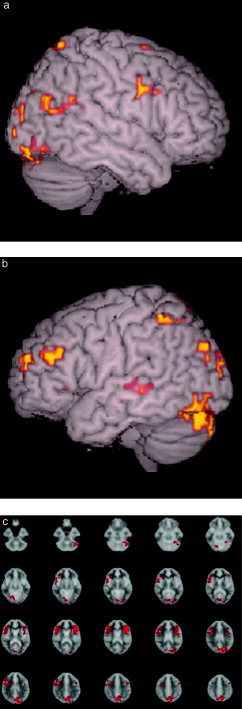
Figure 3.

fMRI statistical map from the ANOVA test between the UR post‐training > UR pre‐training conditions (P < 0.01 cluster level). a: Right hemisphere demonstrating increase in activity in the middle frontal gyrus (9/46) (x, y, z; 58, 9, 24), inferior frontal gyrus (45/47) (43, 6, 41), lingual gyrus (18) (17, −78, −2). b: Left hemisphere showing increase in the middle frontal gyrus (9/46) (−47, 29, 24), medial frontal gyrus (10) (−31, 54, 12), inferior frontal gyrus (45/47) (−46, 21, 0), lingual gyrus (18) (−20, −75, −2). c: Axial slices showing, in addition to the above, increase in the right precuneus (7) (17, −68, 25).
