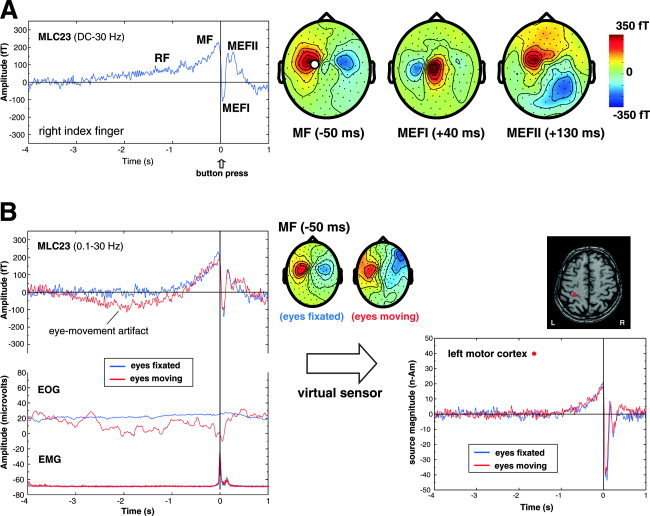
Figure 2.

A: Time average of the movement‐related magnetic fields (BW = DC to 30 Hz) for right index finger flexions (button‐press) in one subject for a channel overlying the contralateral sensorimotor area (MLC23). RF = readiness field, MF = motor field, MEFI and MEFII = first and second movement‐evoked fields. Averages were time locked to the button press (t = 0 s) for 80 movements. The topographic field patterns (nose upwards) of the MF, MEFI, and MEFII are shown on the right with the location of channel MLC23 shown by the white circle (red = outgoing fields, blue = ingoing fields, fT = femtoTesla). B: Effects of eye movement (blue traces) compared to fixation (red traces) on the averaged MEG response for the same subject and channel as shown above. Note the presence of a slow drift in the baseline and distorted topographic pattern of the MF that is not removed by additional high‐pass filtering (0.1 Hz) due to increased eye movement artifact as shown in the electrooculogram (EOG) recorded diagonally over the left eye. In contrast, the SAM virtual sensors for the MF source on the right show no effect of eye movement artifacts on the virtual sensor baseline or amplitude. Surface electromyogram recorded from the forearm flexors (EMG) shows the onset of muscle activity preceding the button press by ∼80 ms.
