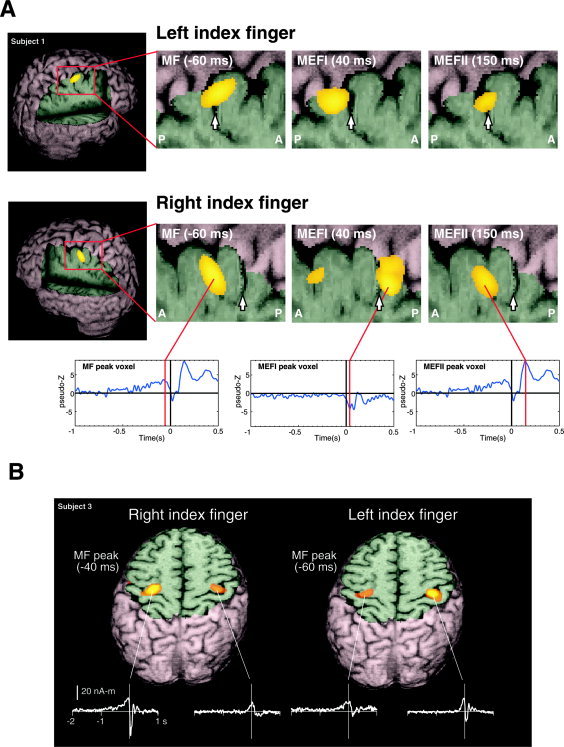
Figure 3.

A: Event‐related SAM (ER‐SAM) images of contralateral sensorimotor cortex activity created at 2‐mm resolution for left and right index finger movements, superimposed on rendered MR images of a single subject. The location of the central sulcus is shown by a white arrow in the magnified views of contralateral sensorimotor areas, showing a shift in peak location of the MF, MEFI, and MEFII from precentral to postcentral locations. The averaged virtual sensor for the peak location for MF/MEFII and MEFI are shown below. B: ER‐SAM images for left and right index finger movements in a single subject, superimposed on an axial MRI slice through the contralateral and ipsilateral hand region of the precentral gyrus. Shown below are the non‐noise normalized average virtual sensor waveforms (in units of nanoAmpere‐meters) for the peak locations in the primary motor cortex. Images were created using the mri3dX program.
