
Figure 4.
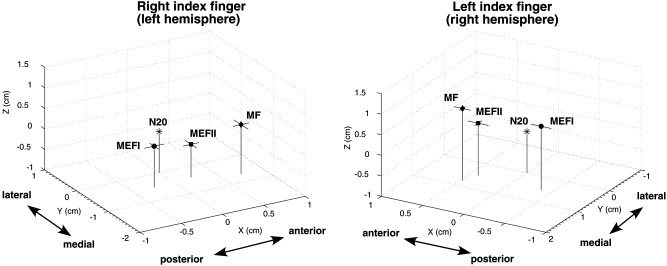
Mean locations of motor field (MF), movement‐evoked field I (MEFI), and movement‐evoked field II (MEFII) peak locations from the ER‐SAM images for right and left index finger movements for all eight subjects, plotted relative to an origin (0, 0, 0) defined by the location of the dipole fit to median nerve stimulation (N20m) of the same hand. The axes correspond to the MEG coordinate system (x = posterior to anterior, y = right to left, z = inferior to superior). Horizontal bars indicate 1 standard error of the mean in the x and y directions. Mean distances between peak locations are given in Table I.