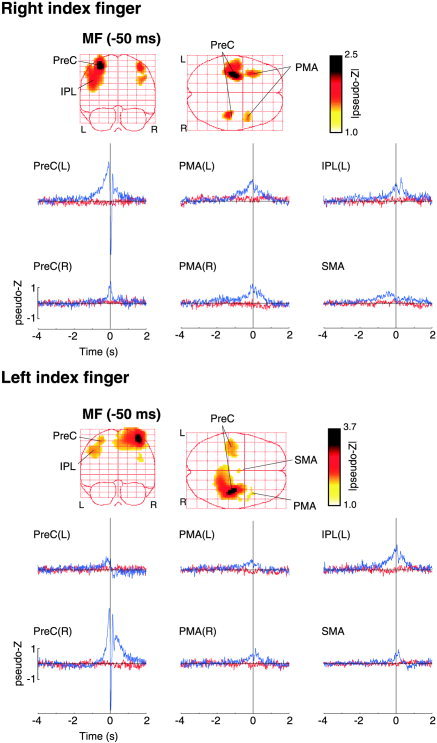
Figure 5.

Group ER‐SAM images for right (top panel) and left (bottom panel) index finger movements (n = 8). The maximum intensity projections (left) of the motor field (MF) component (latency = –50 ms) averaged across subjects are shown with a pseudo‐Z threshold value of 1.0. Six main peaks of activation were detected in the volumetric images in the right and left precentral gyrus, PreC(R) and PreC(L), the right and left lateral premotor areas, PMA(R) and PMA(L), the left inferior parietal cortex IPL(L) and the left supplementary motor area (SMA). The Talairach coordinates of these peak locations are given in Table II. The group averaged virtual sensors corresponding to the peak locations are shown in the plots below (blue traces). The red traces show the virtual sensors based on the plus‐minus averages for the same locations.
