
Figure 3.
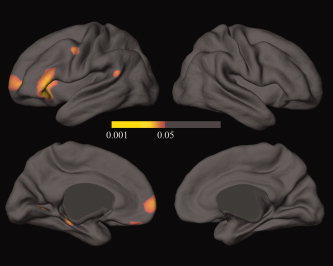
FDR‐corrected statistical maps of the differences in cortical thickness between OCD patients and control subjects. The color bar encodes the FDR‐corrected P‐value demonstrating differences in cortical thickness between OCD patients and control subjects. Callosal, subcallosal, cerebellum, and midbrain regions were excluded.