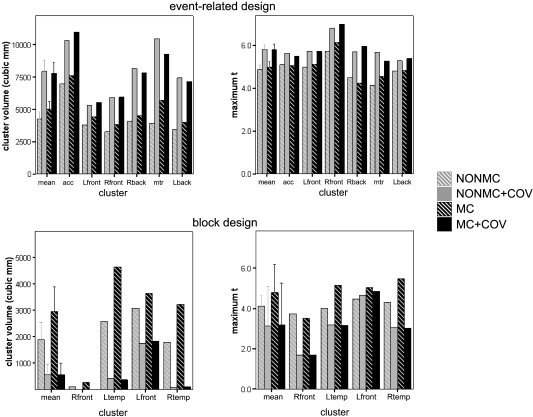
Figure 3.

Thresholded cluster volumes (left) and maximum t‐statistics (right) for the event‐related design (top) and the block design (bottom). Gray bars represent results for non–motion‐corrected images (NONMC), black bars represent motion‐corrected images (MC); cross‐hatched bars represent no use of motion covariates (NOCOV), solid bars denote use of motion covariates (COV). Bars show results for individual clusters, as well as means across clusters (left‐most columns in each graph).
